

Metrics and activity
See a server's CPU, memory, network and disk usage over time, and the log of everything that happened to it, from power changes to resizes.
Metrics
The Metrics tab shows graphs of:
- CPU: percent of all cores;
- Memory: percent in use, with gigabytes used;
- Network: traffic in and out on the public interface, in Mbps;
- Disk I/O: reads and writes in MB/s;
- GPU utilization and VRAM, on AI servers.
Each graph shows the average and the peak for the time range you pick. Usage is sampled every 5 minutes and kept for 30 days.
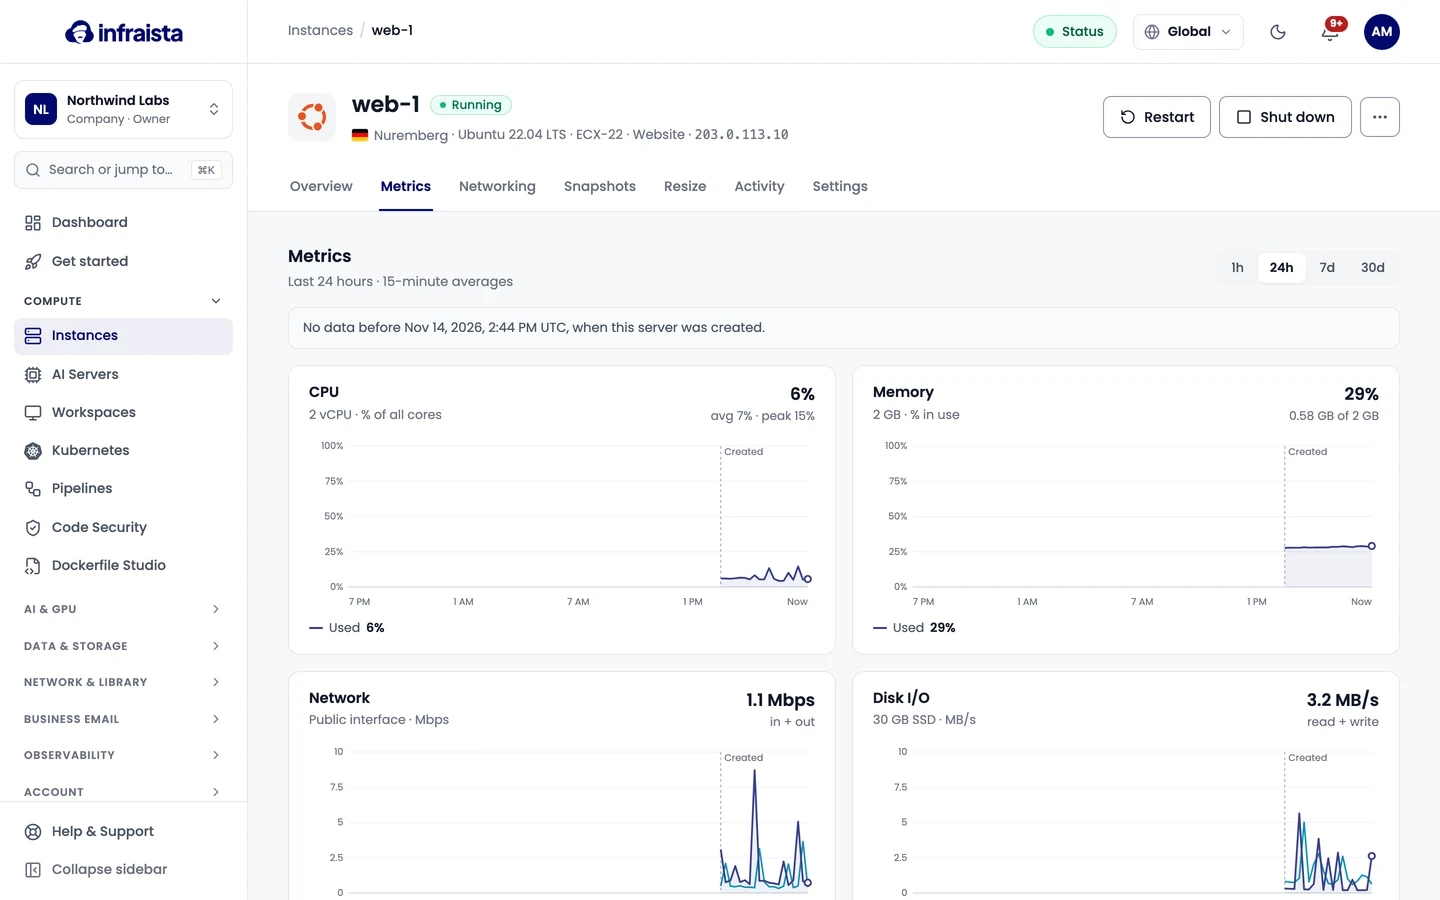
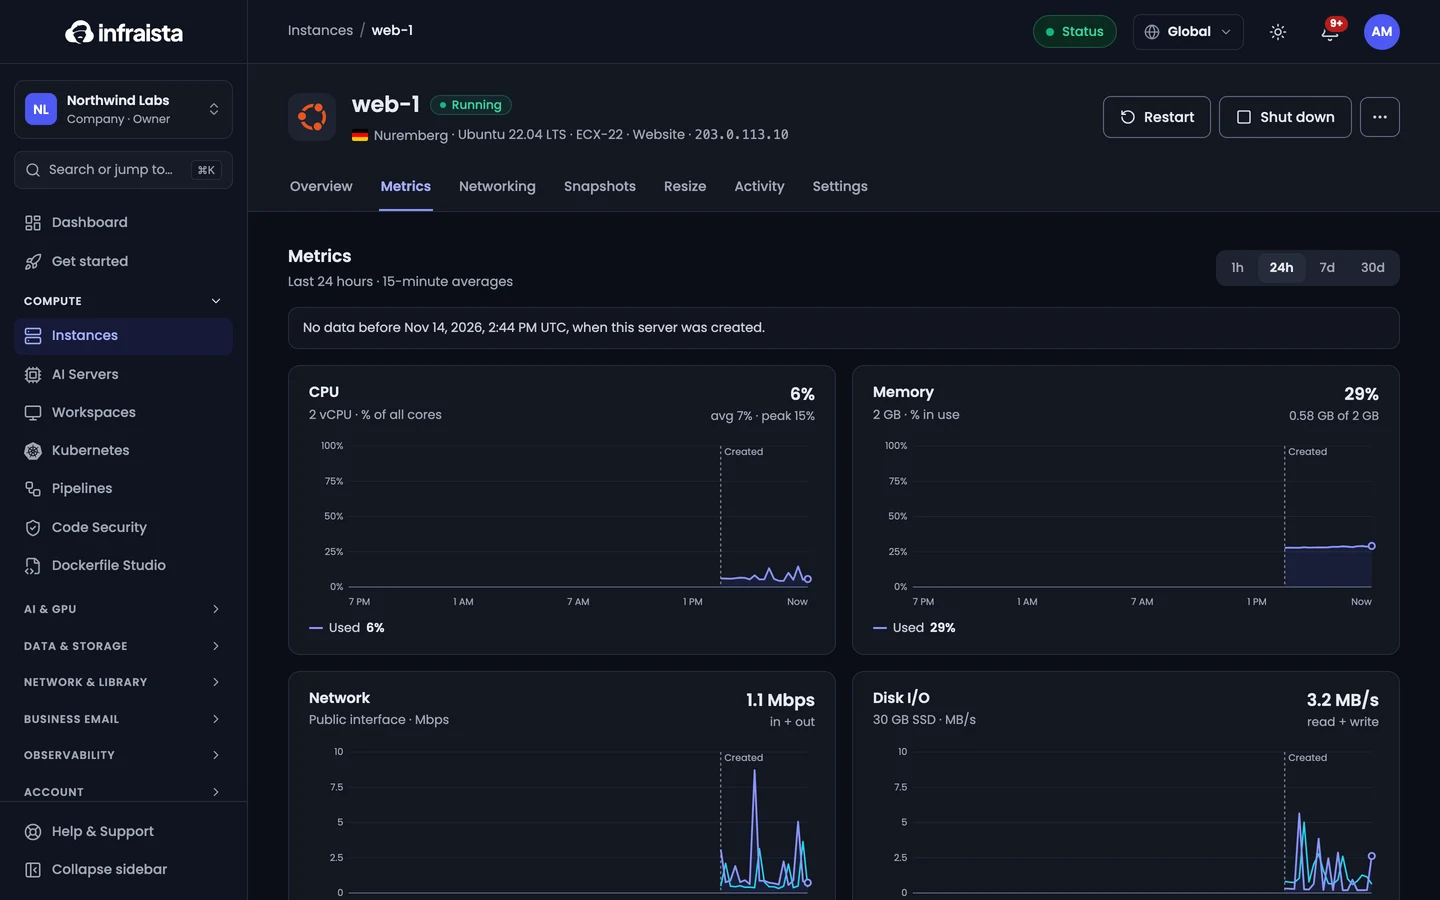
Right after a server is created, the tab says Collecting usage: the first numbers appear shortly and the graphs fill in over the next hours.
Want to know right away when a server needs attention? Turn on Instance updates in Notifications.
Activity
The Activity tab lists everything that happened to the server, newest first: power changes, network and firewall changes, billing changes, password resets, snapshots and resizes. Each entry says who did it: a teammate, Infraista (automatic actions) or Support.
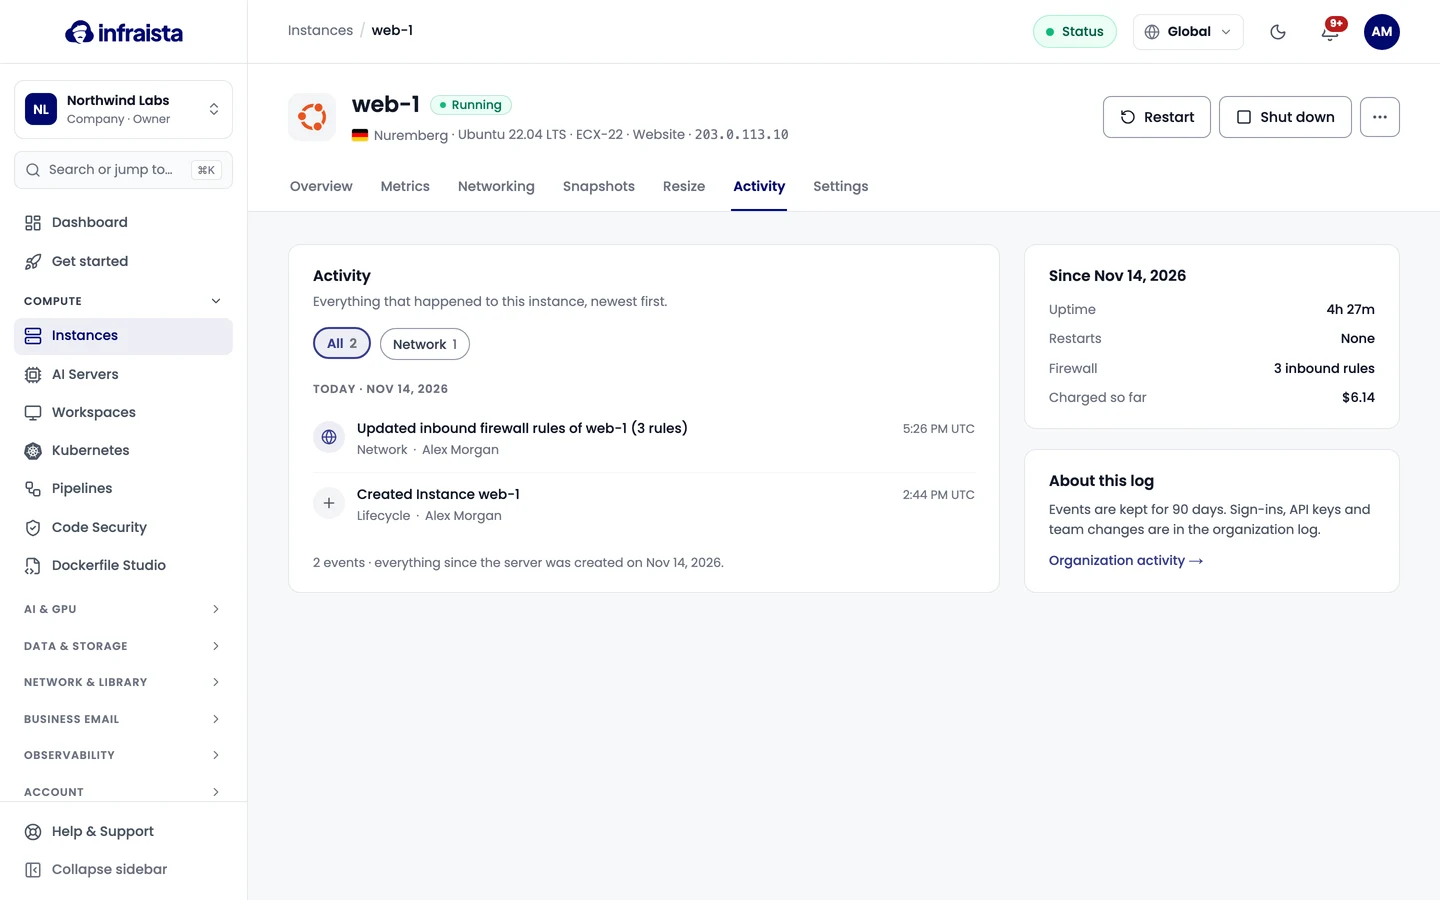
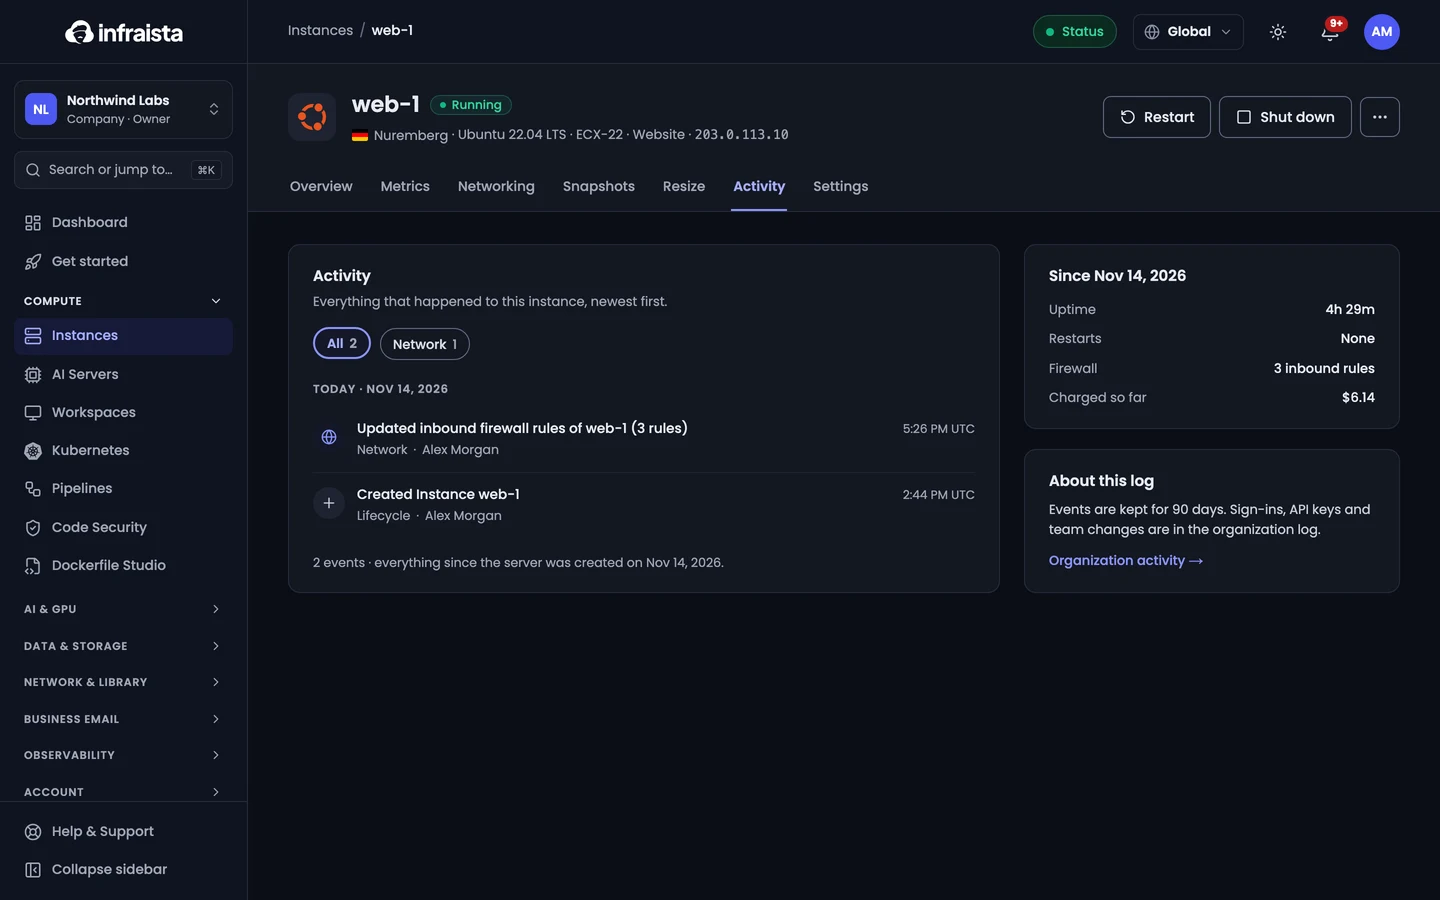
Filter by kind (Power, Network, Billing, Access, Snapshot, Lifecycle) to find something quickly. Events are kept for 90 days. Sign-ins, API keys and team changes are in the organization's Activity log.
Related
Switch between hourly and monthly billing
Pay a fixed monthly price for a server that runs all month, or switch back to hourly billing, and see exactly when each change takes effect.
Rename, move or delete a server
Rename a cloud server, move it to another project so its costs show there, reset the root password, or delete the server and stop billing.