

Billing
Usage and Cost Explorer
See what your organization has used this month by resource, and explore costs over time by product, project, region or resource with forecasts.
Usage
Account › Usage shows what this organization has used in a period: total cost, resource-hours, cost by product, and every resource with its hours and cost. Filter by Period, Resource type and Project, and Export CSV.
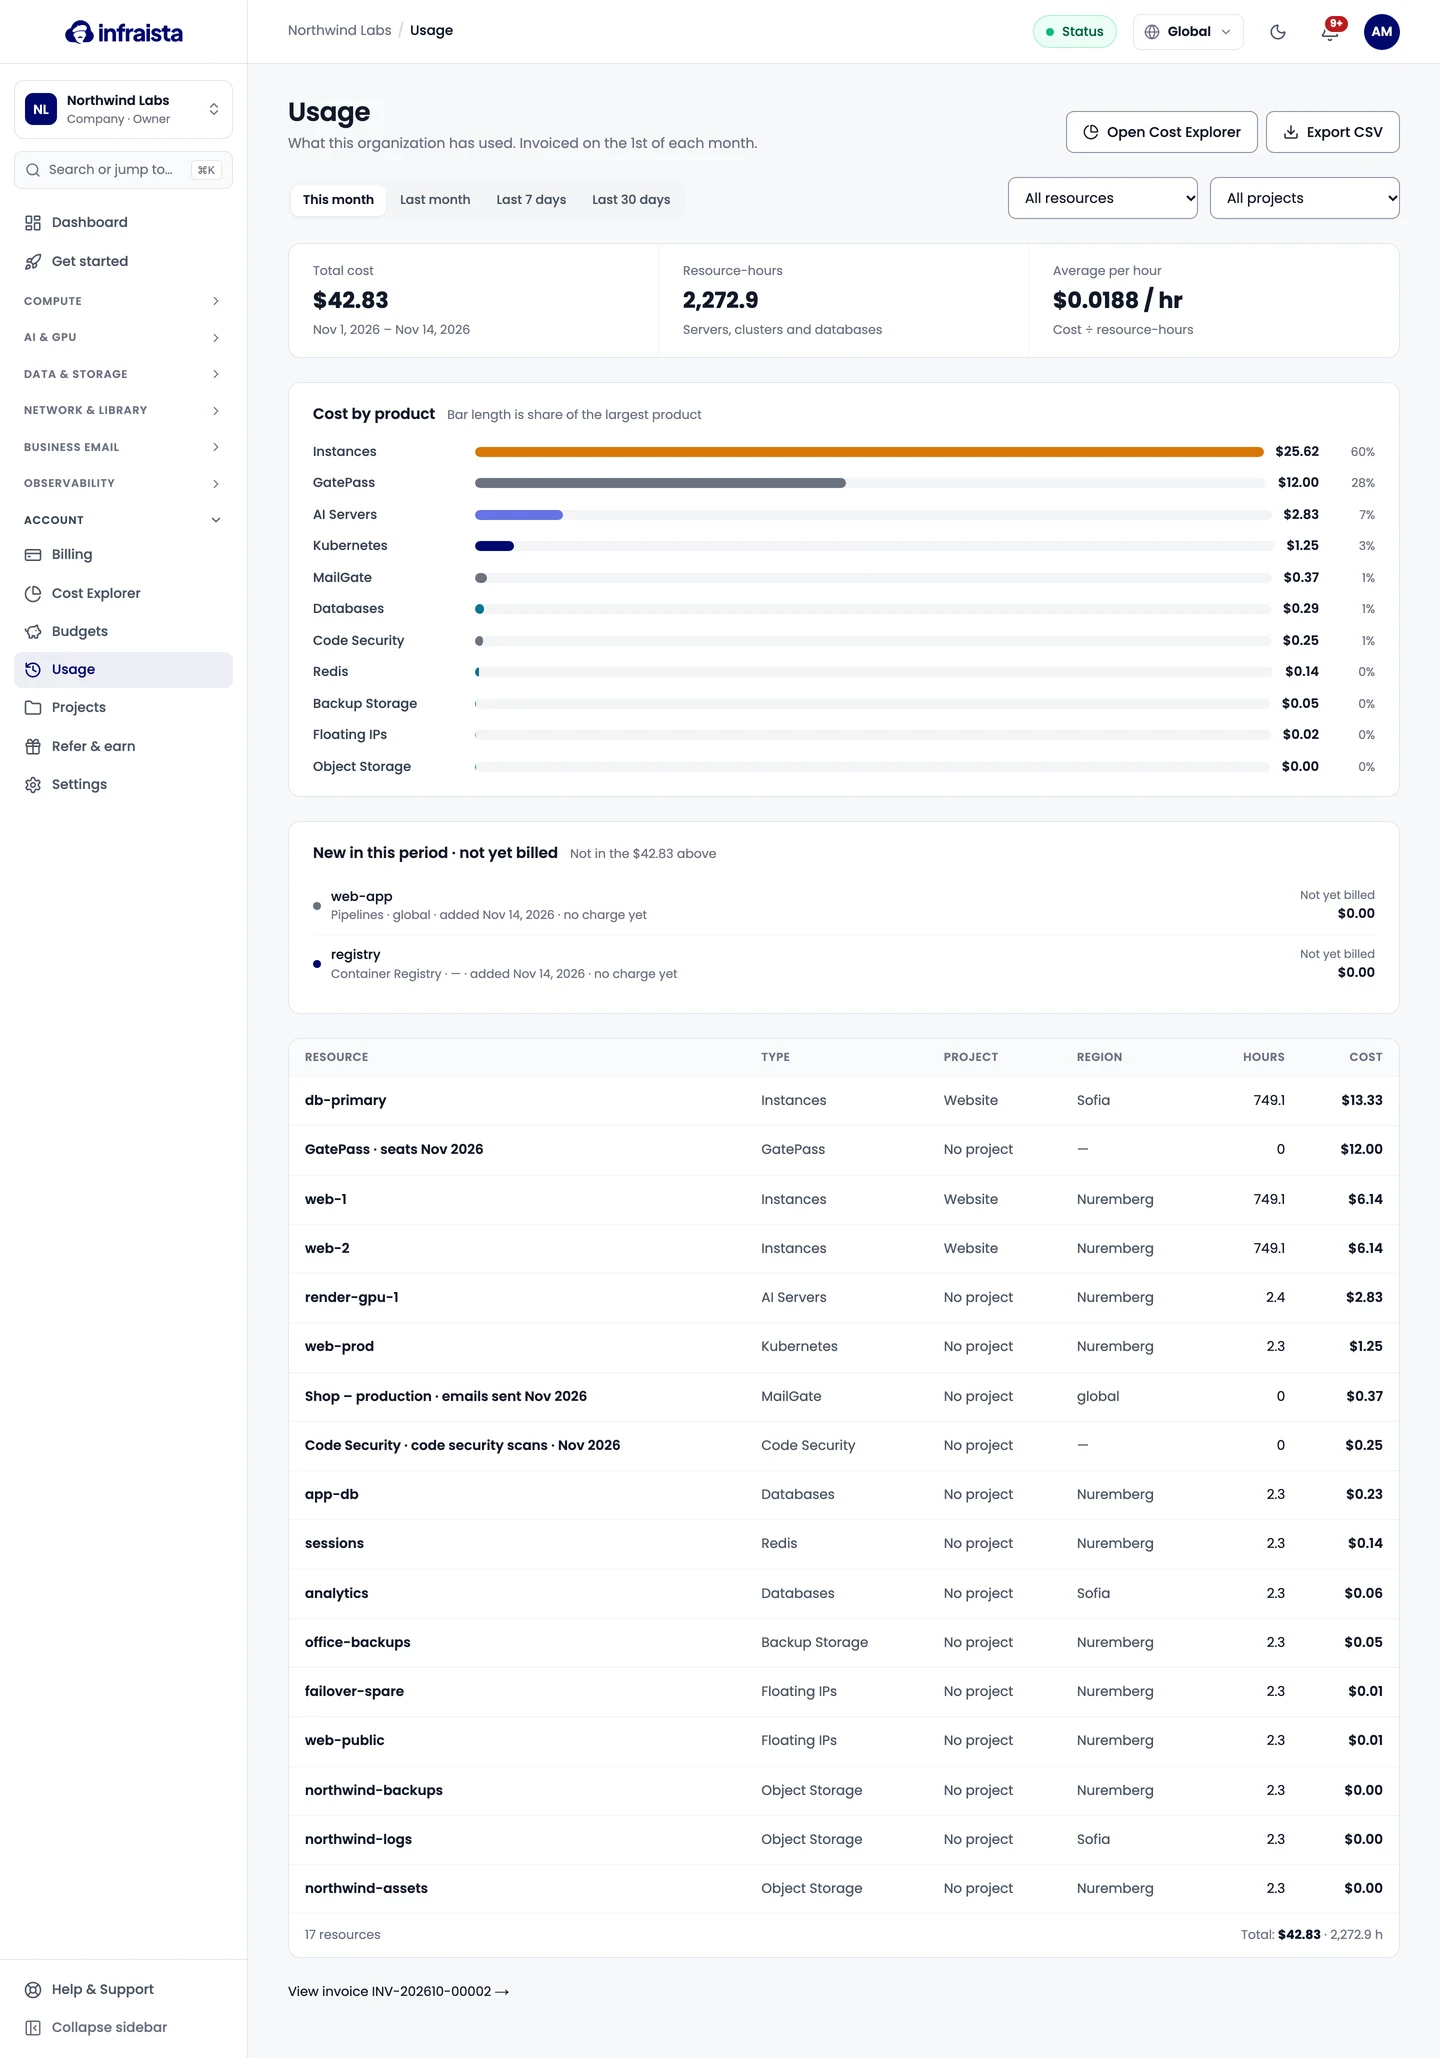
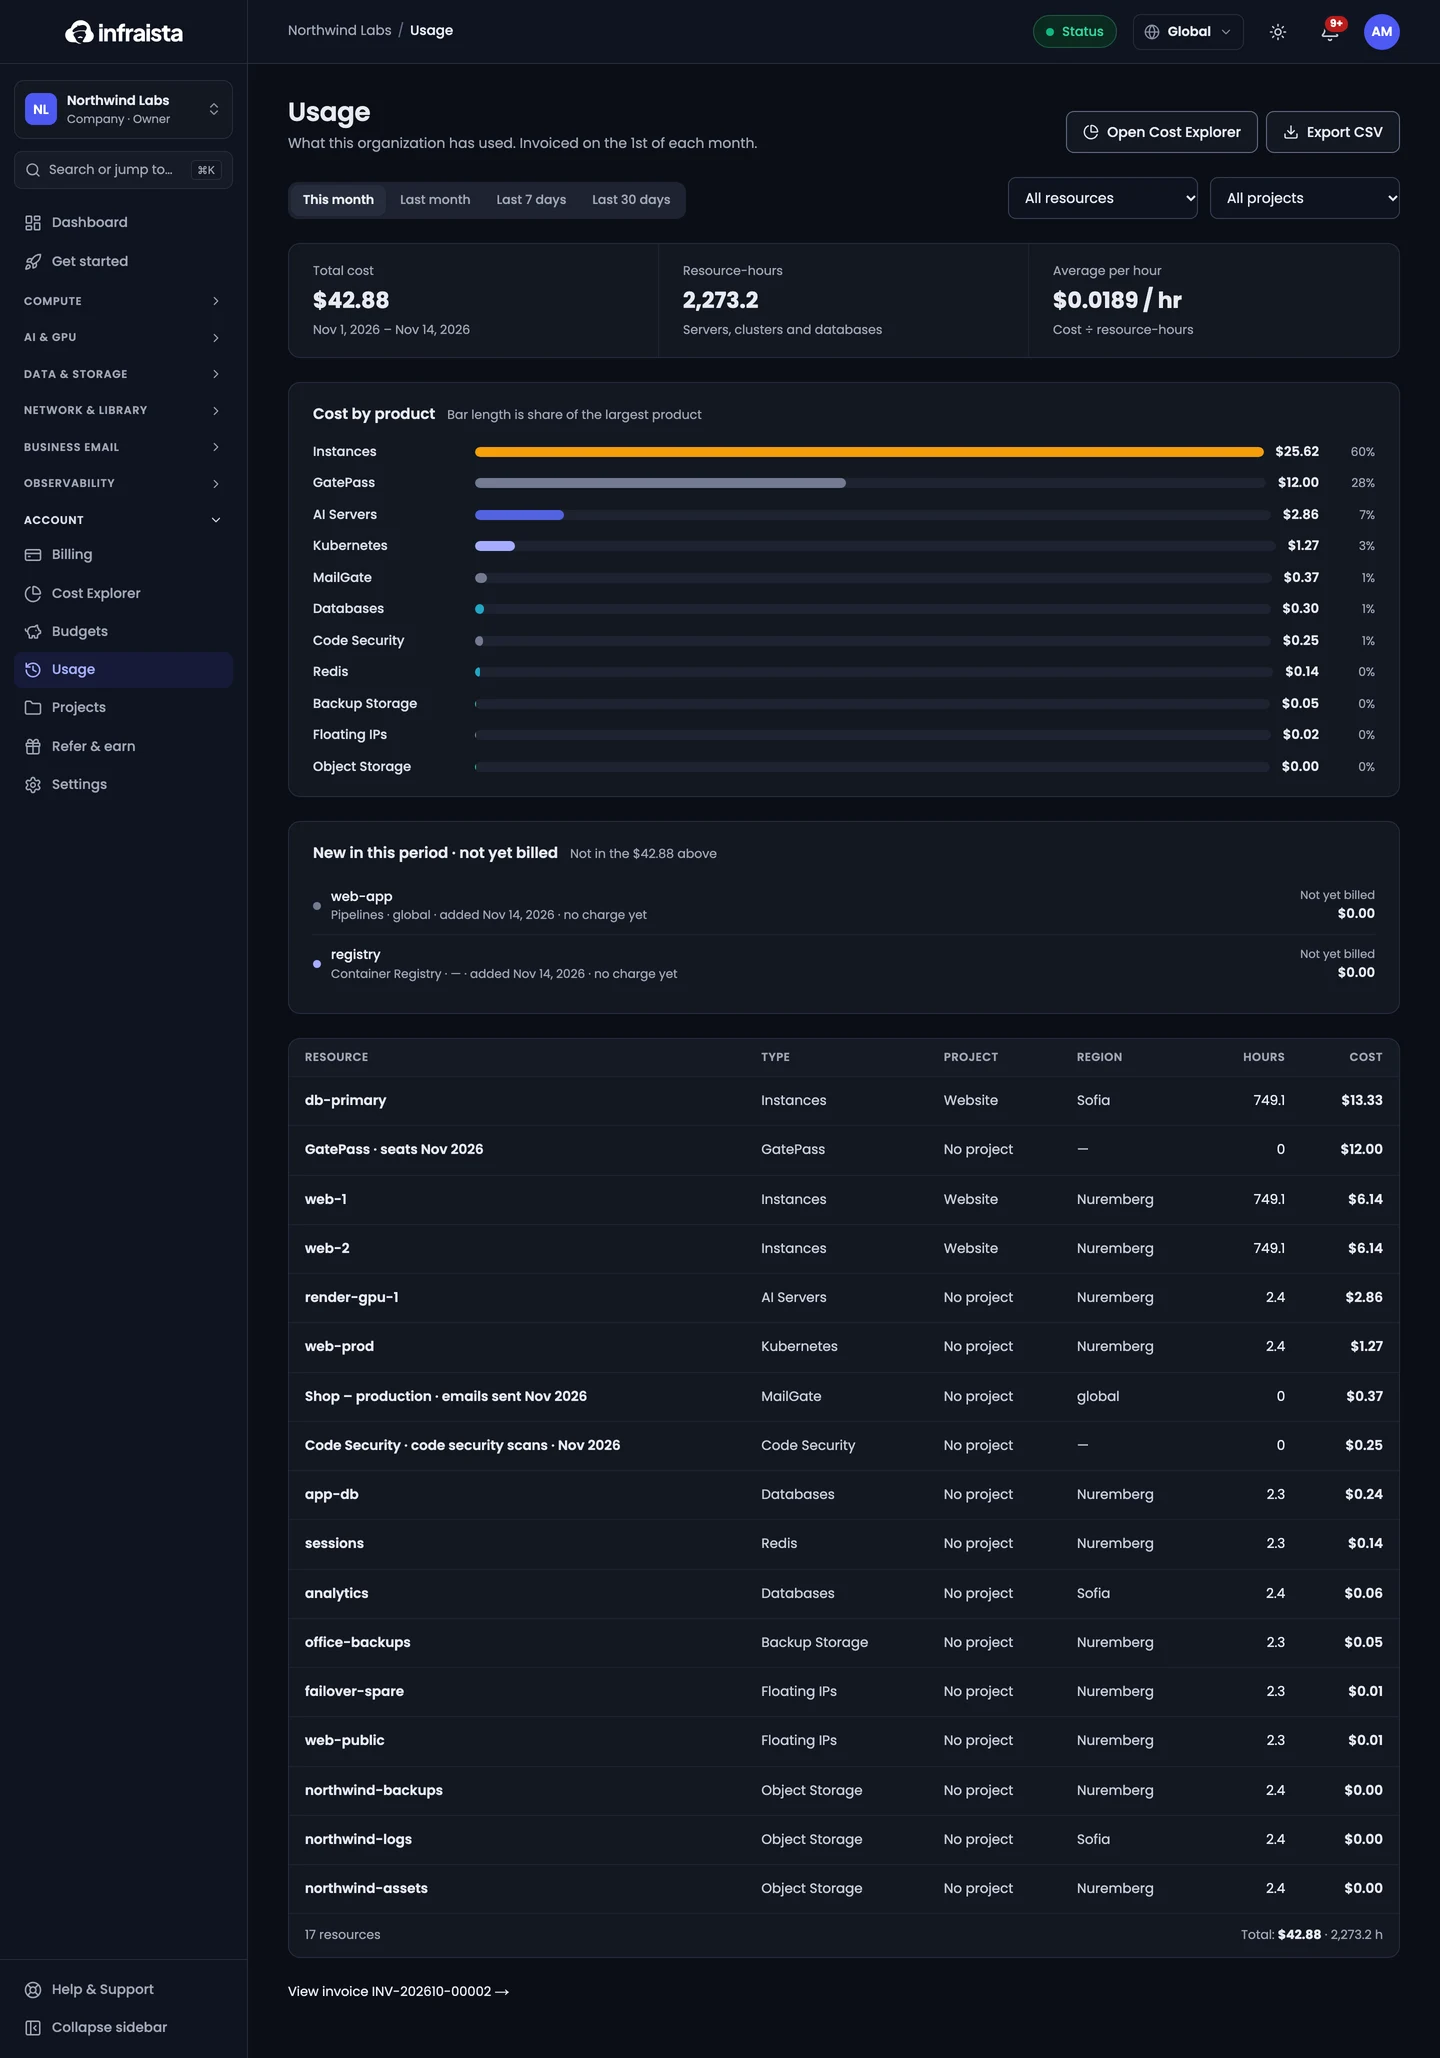
Resources created recently that haven't produced a charge yet are listed under New in this period · not yet billed.
Cost Explorer
Account › Cost Explorer charts your spend over time:
- Date range: month to date, the last 7, 14 or 30 days, last month, or the last 3 months;
- Granularity: daily or monthly;
- Group by: product, project, region or resource;
- filters for products, projects and regions, and Show forecast for the rest of the month.
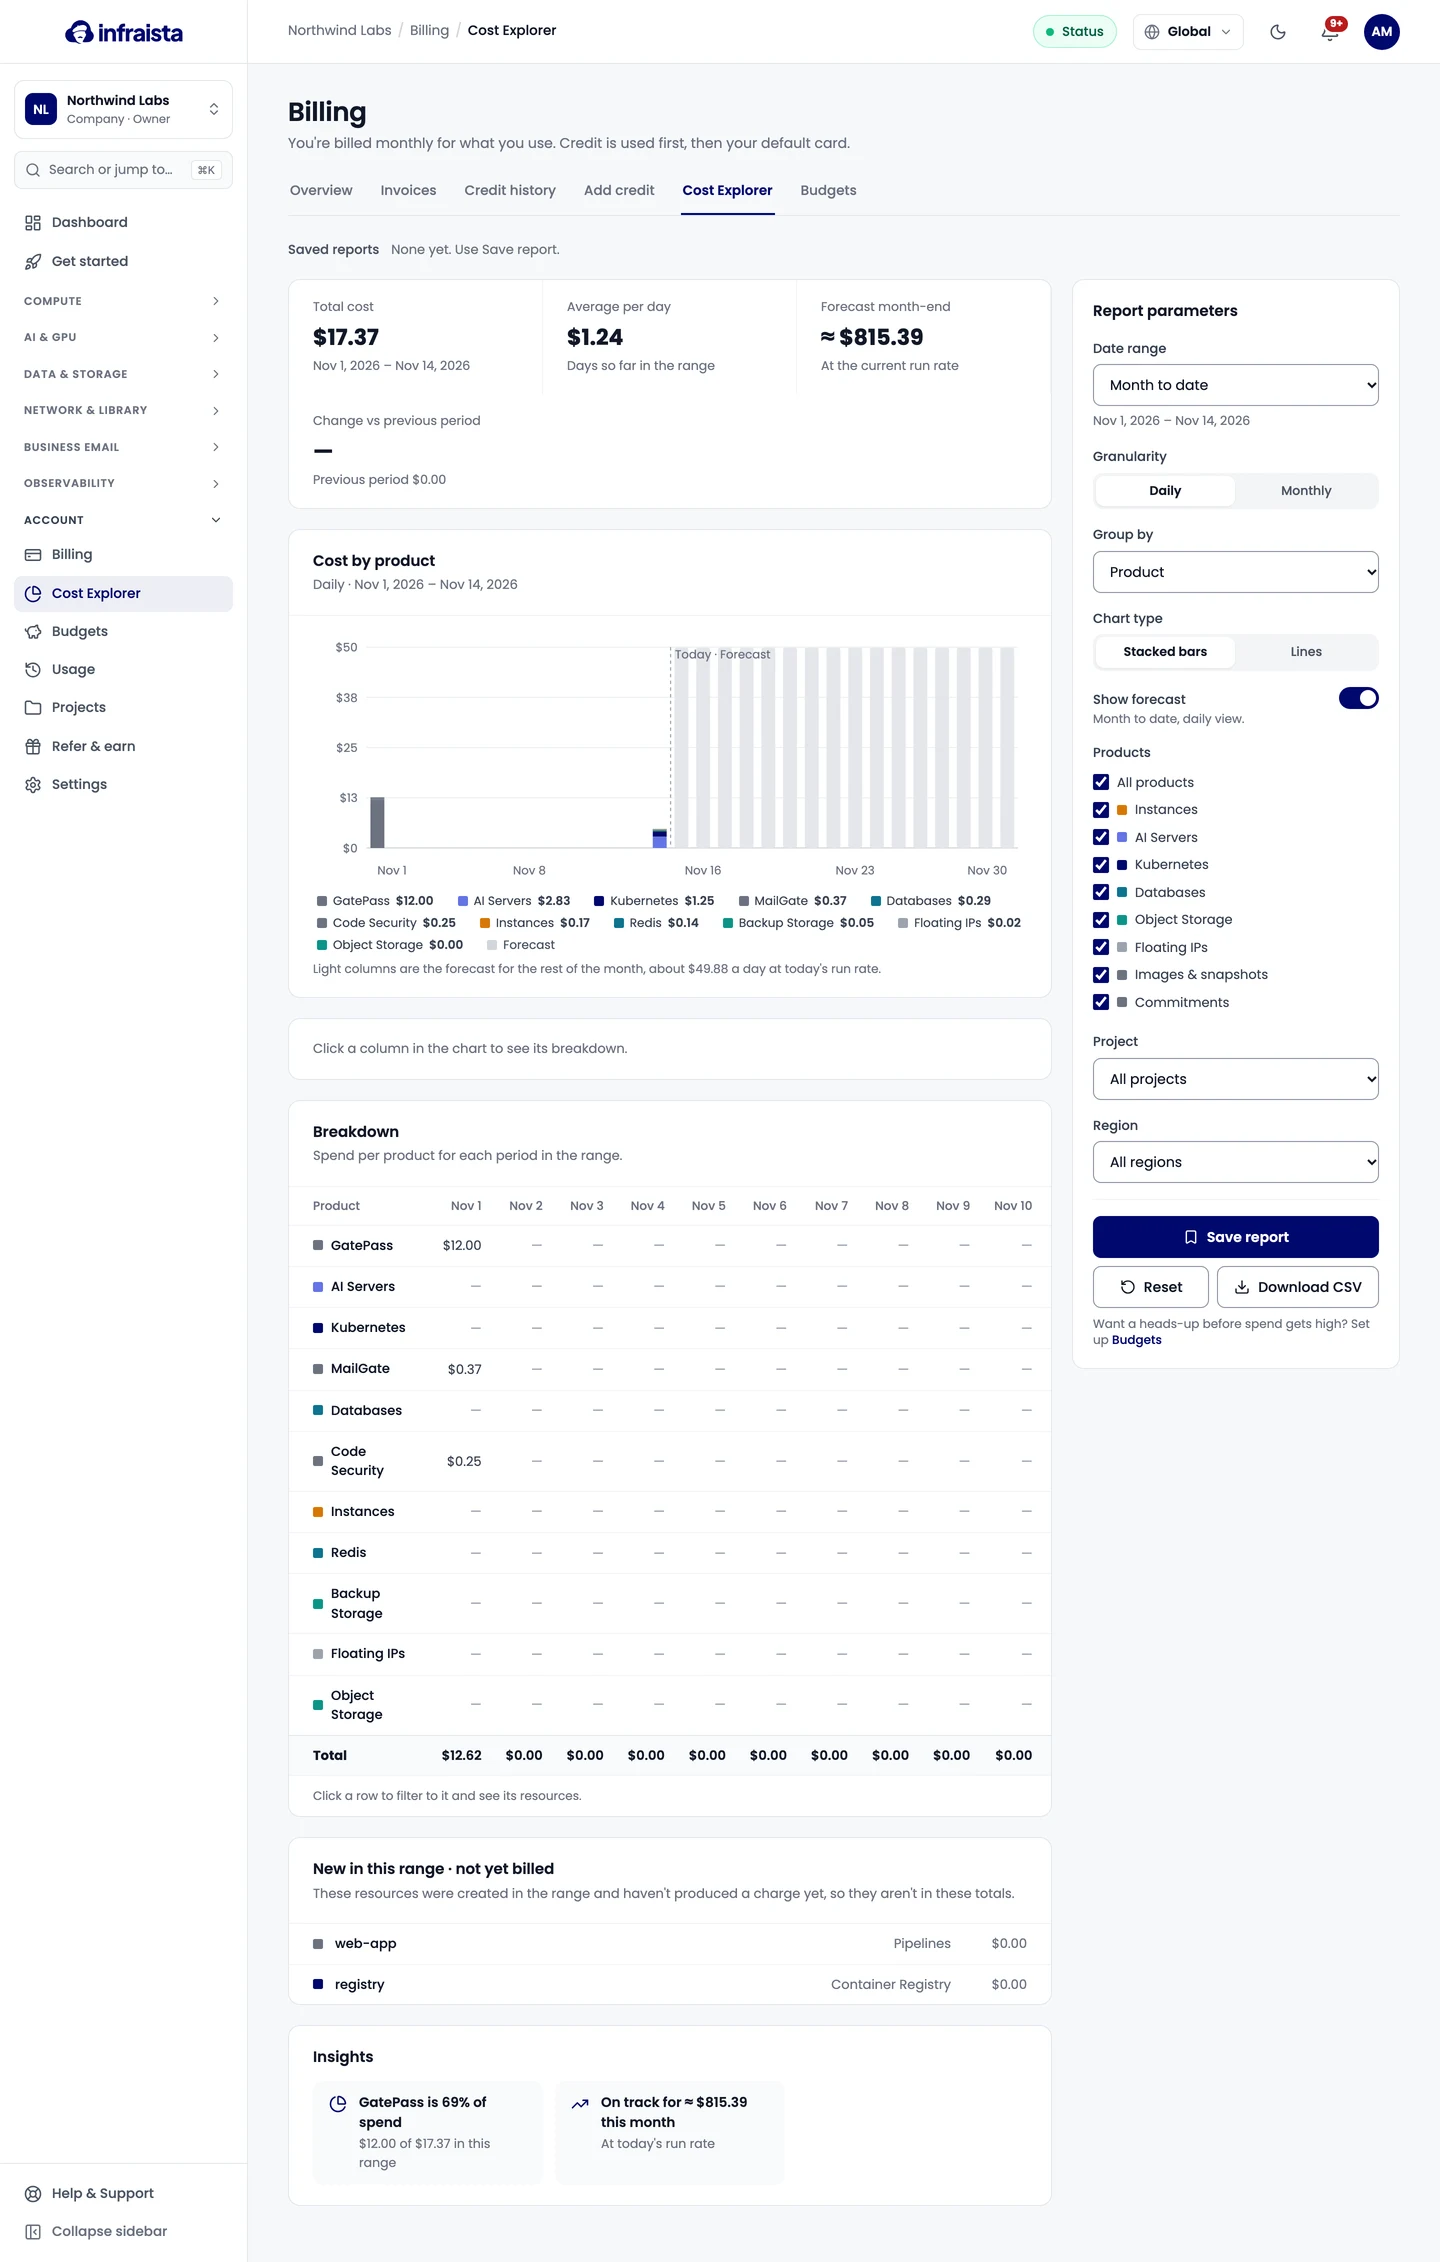
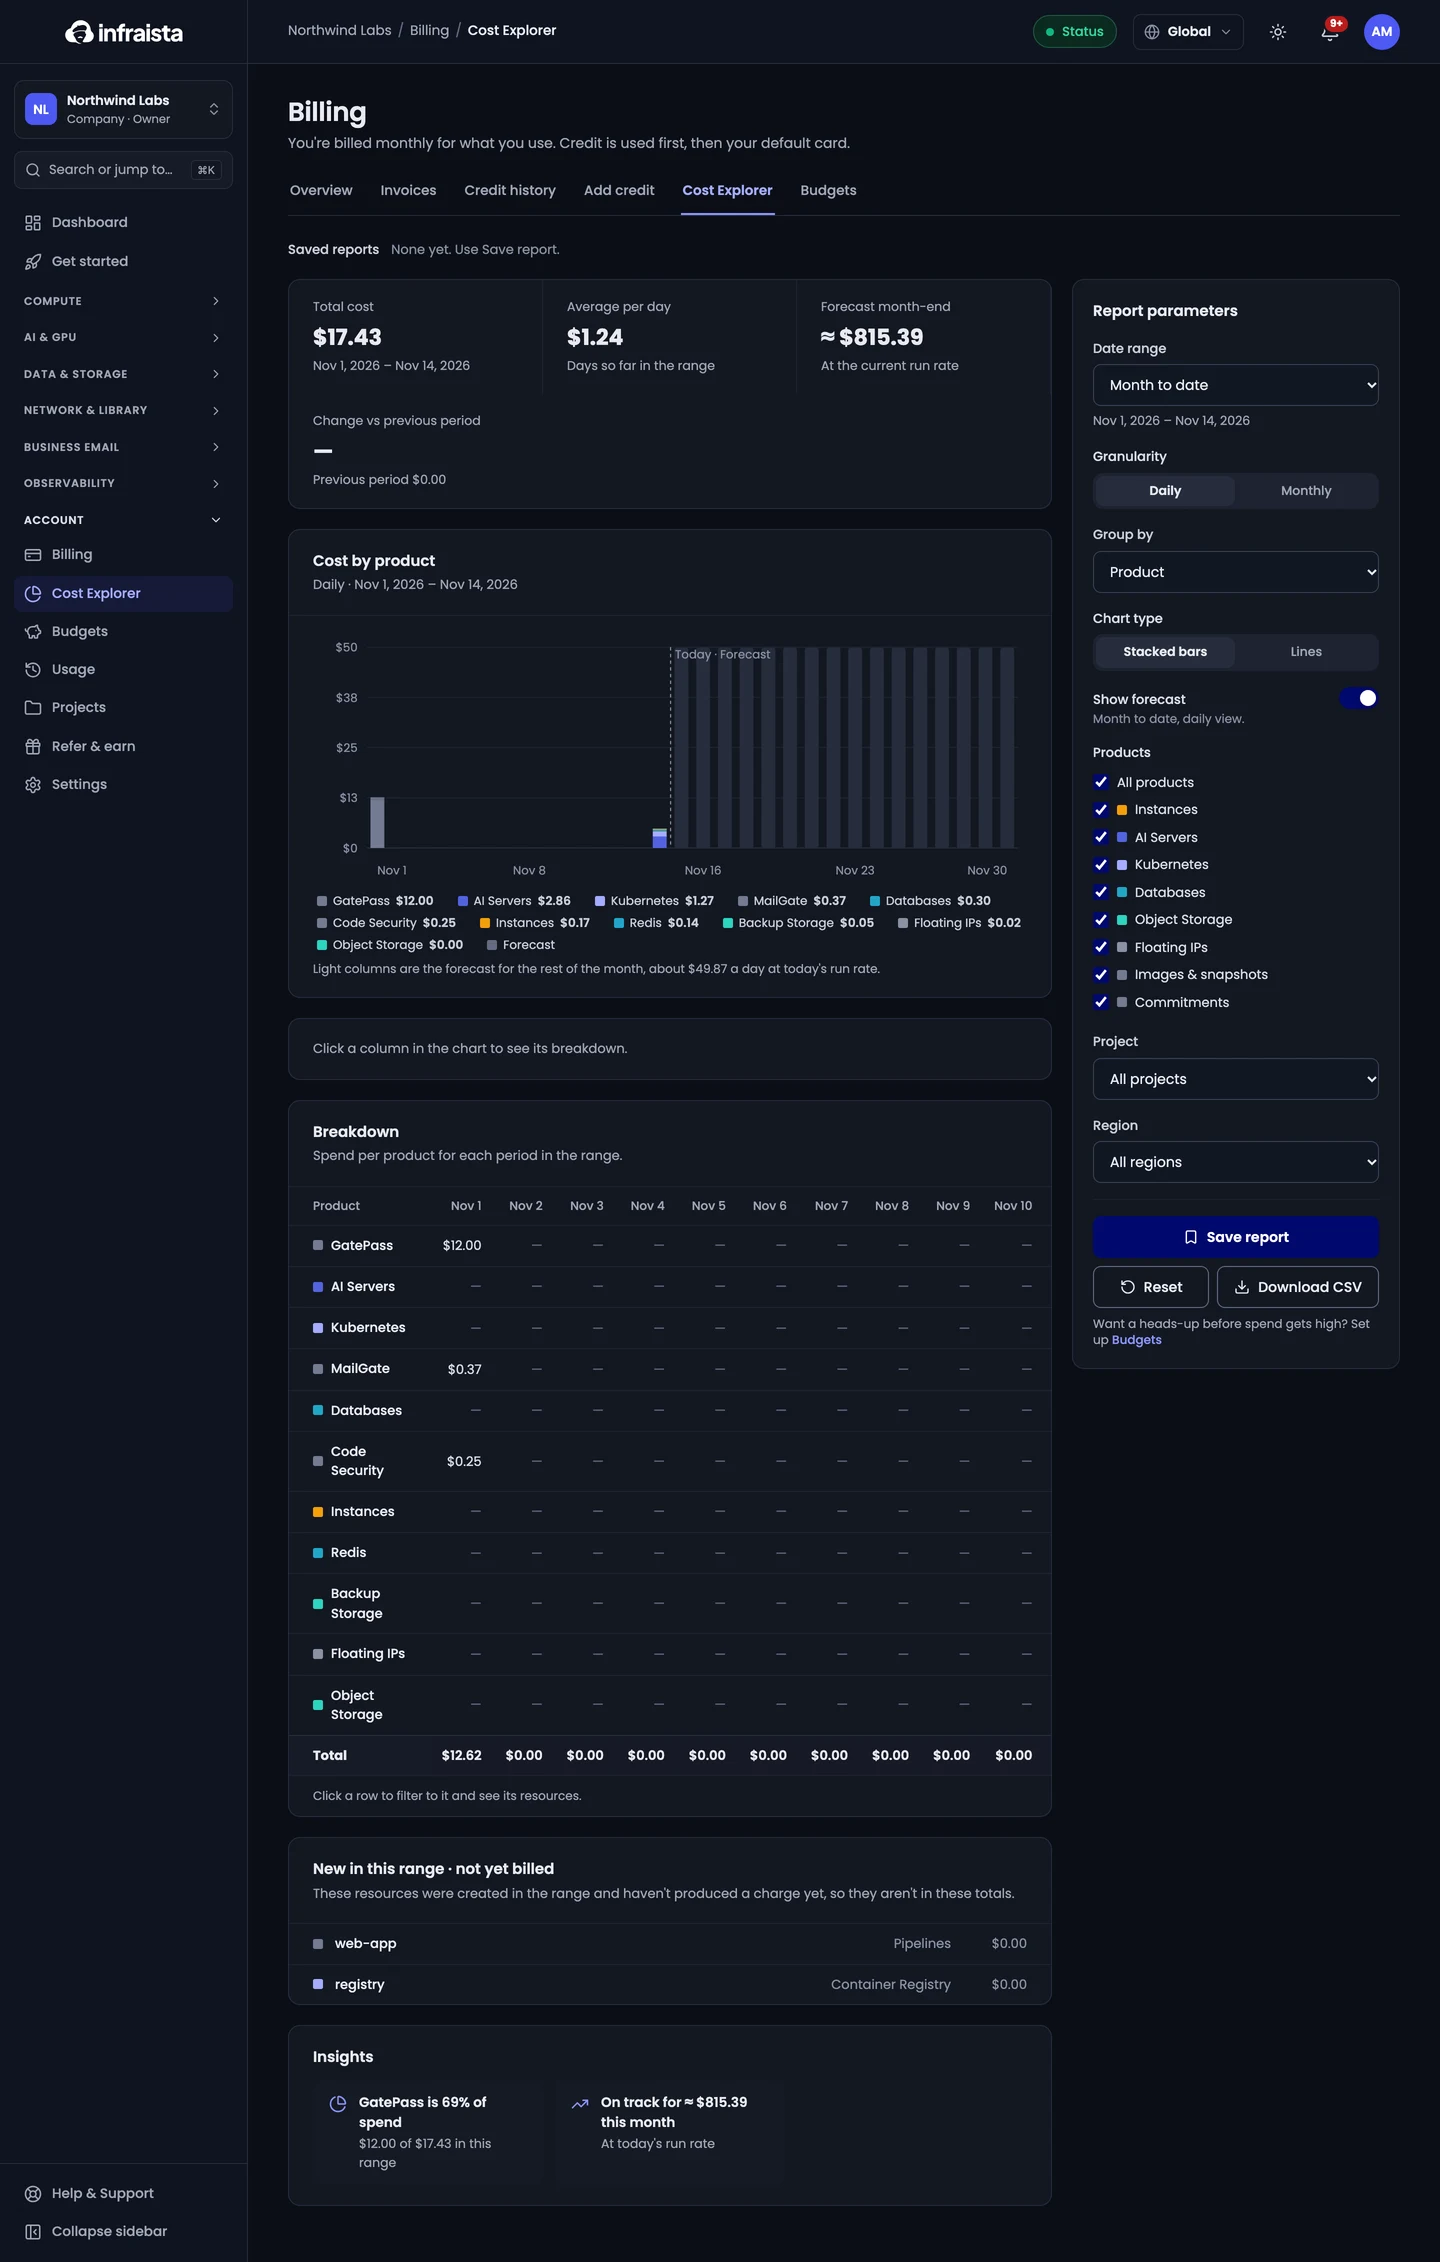
Click a column to see its breakdown, or a row in the table to filter to it. Save report keeps the date range, grouping, filters and chart type; Download CSV exports the table.